6.4.Austria-1-detail-c Highlights Relevant to Sustainable Design:
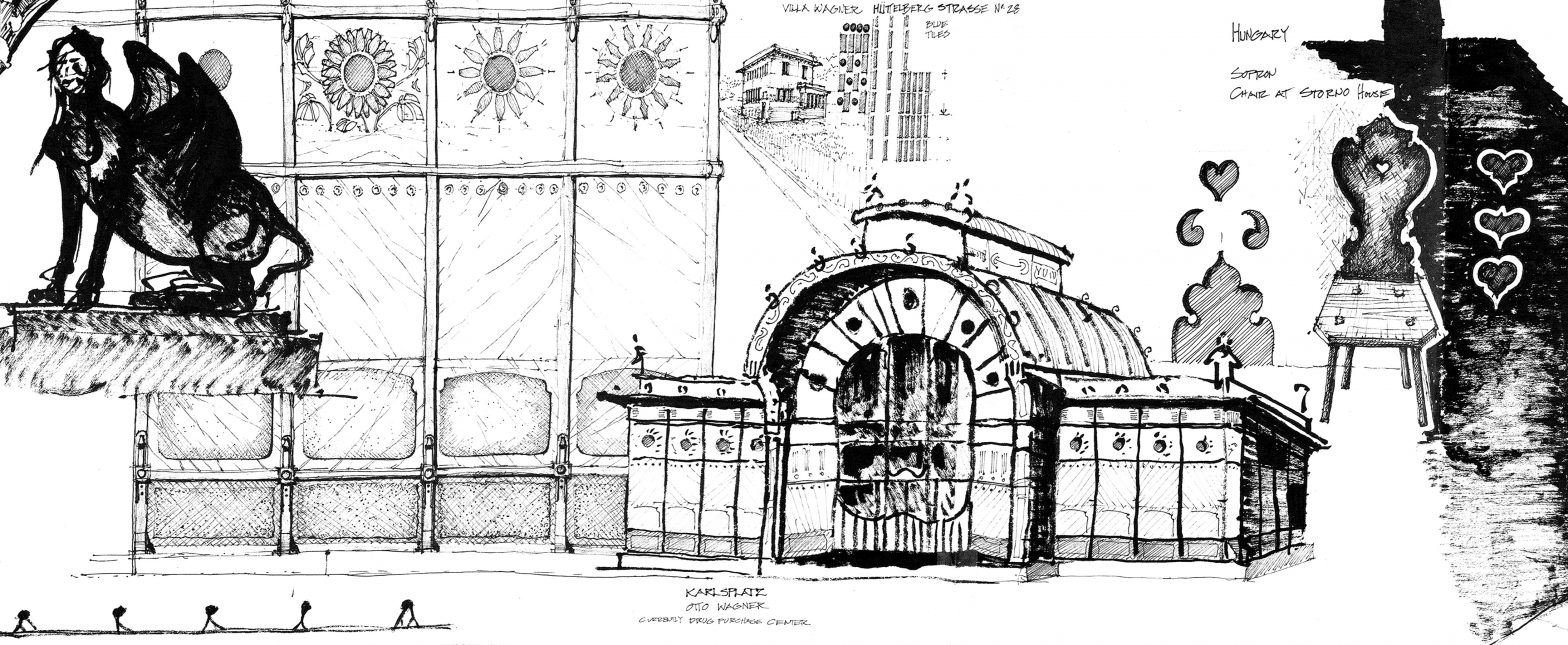
Visually inviting entrances to underground subway systems increase the use of the systems.
This entrance to one of the many Vienna subway system stations was designed by celebrated Austro-Hungarian architect and urban planner Otto Wagner (1841–1918). The structure is made of glass and metal with intricate details and sunflower ornamentation. During the day, it glistens in the sun, and at night, it glows like a lantern.
In America, we are moving increasingly toward what I have started calling the “Uber age.” With the ease of the Uber car service, individuality and immediacy trump the collective and the scheduled. Think of the difference between single passenger transportation that is on-demand with the simple push of a button on our smartphones versus group transportation on a local train with a schedule of arrivals and departures. The freedom of on-demand transportation dramatically changes how we think about moving around and has implications on fuel consumption. There are certainly places for individual and collective transportation when it comes to commuting and socializing, and improved mass transit could help encourage more options both above and below ground. On the social front, Uber provides a convenient and safe way to travel for a night out, without the need for a designated driver within the traveling party. Here are multiple ways that my wife and I travel from the suburban town, Wayne, to Philadelphia for dinners or parties in the city. The distance is approximately eighteen miles each way, and we targeted the Main Line area in part because of the convenient access to local train transportation as well as great schools and other advantages. We can walk to the train station that is about a quarter mile from our house. This breakdown is ranked from most energy efficient to least (note: the train is about seventeen miles versus driving eighteen miles):
Round-Trip—Miles Impact for Two Couples:
1: We take the train down and back. Most energy efficient. 34 miles
2: We take the train into town and get a ride home with friends. 35 miles
3: We pick up another couple, or they pick us up for ride sharing both ways. 40 miles
4: We share an Uber car service with one or more other couples both ways. 48 miles
5: We drive in our own cars down and back—two couples. 72 miles
6: We each take an Uber car service both ways. Least energy efficient. 80 miles
(Depending on the time of day, in-city Ubers may be close to the pick-up location, decreasing the distance by four miles. However, if the drivers do not get called for rides back into the city, there could be an added return to the city trips, bringing the life cycle cost up to 116 miles, more than three times the train or ride sharing trip.)
The Uber fuel impact is larger than you might think given the distance to pick you up. The average wait time for Uber in our area has been about six to ten minutes. At an average of thirty miles per hour on suburban streets, eight minutes is about four miles. So this adds four miles of fuel to an eighteen-mile trip. This is a 22 percent increase in fuel consumption, and while the riders don’t pay for the gas, the fuel cost is accounted for in the service cost. When I have taken an Uber from one suburban town to another with a distance of only two miles, the same wait time applies. If the driver takes four miles to get to me, this means that the fuel consumption is 200 percent greater than the trip itself for me to get from A to B. At an extreme level, if everyone took a car service instead of going from point A to B through other means, the added connection times would increase our US transportation fuel consumption by 20 percent to 200 percent. The increase in development of autonomous self-driving cars may help reduce the burden of the extra miles incurred with driving services.
I was pleased to see in a 2015 interview, on the Late Show with Stephen Colbert, that Uber’s CEO, Travis Kalanick, has plans to increase the number of electric cars, perhaps through a fleet of Tesla cars produced by Elon Musk. Electric cars still create life cycle source emissions given the generation of electricity in coal-fired power plants. However, the emissions are significantly lower. According to the US Department of Energy, for a hundred-mile trip, a conventional combustion engine car emits ninety-nine pounds of CO2 and costs $9.96, while electric cars only emit fifty-four pounds of CO2 and cost $3.56.[i] This emissions savings of almost 50 percent is meaningful as is the cost reduction, given the growing number of Uber miles and the ongoing volume of transportation miles across America each year. The cost ranking for the round-trips addressed here are almost an exact reflection of the energy efficiency rankings. The train is the least expensive and the Uber single-couple ride is the most expensive. The advantage of ride sharing is reduced parking costs as well as the reduced fuel cost per passenger relative to the single-couple car rides. We have strength in numbers!
Author and illustrator: Charlie Szoradi is an architect, inventor, and the CEO of Independence LED Lighting. He writes about many other topics related to transportation and car services like Uber through his extensive travels around the world.
If you have found this posting online, it is an excerpt from Mr. Szoradi’s book Learn from Looking that served as the inspiring seed content for this drawing share resource. For additional drawings and insights on transportation, we hope that you enjoy exploring LearnfromLooking.com. You can search via general terms such as sustainability as well as narrower terms such as public transportation and individualized transportation such as Uber.
[i] Electric versus Other Cars:
Austria 1: Detail (c), US Department of Energy—Alternative Fuels Data Center: http://www.afdc.energy.gov/vehicles/electric_emissions.php.


